Congress trading
Every stock trade disclosed by Congress
Every line of every STOCK Act report we hold, from House Clerk and Senate recordsEvery STOCK Act trade since 2014. Newest filing first, as of Oct 2, 2026; narrow the record by member, party, chamber, ticker, account or size, and every name and ticker opens its own page.
reports 381 to 400 of 528, 715 of more than 10,000 trades filed in the last 12 months
Newest filing first · newest filing Oct 1, 2026 · data as of Oct 2, 2026
Bands are as reported, never a figure. Since the trade is the stock's move after it, estimated from market prices, not the member's result. Not investment advice.
-
-
Traded Jan 30, 2026, 11 days earlier$1,001 - $15,000Since trade +19.2%S&P 500 +10.2% · 9.0 pts ahead of S&P 500
-
Traded Jan 30, 2026, 11 days earlier$1,001 - $15,000Since trade +19.5%S&P 500 +10.2% · 9.3 pts ahead of S&P 500
-
Traded Jan 21, 2026, 20 days earlier$1,001 - $15,000Since trade +15.5%S&P 500 +11.2% · 4.3 pts ahead of S&P 500
-
Traded Jan 20, 2026, 21 days earlier$1,001 - $15,000Since trade -12.5%S&P 500 +12.5% · 24.9 pts behind S&P 500
-
-
-
bought ETF TR Gold Miners ETF Gdx. FundTraded Jan 28, 2026, 12 days earlier$1,001 - $15,000n/a
-
sold ERTS SER TR State ST Mid Cap Val MdyvTraded Jan 28, 2026, 12 days earlier$1,001 - $15,000n/a
-
-
-
bought Amrize AG Cmn OtherTraded Jan 30, 2026, 7 days earlier$1,001 - $15,000n/a
-
Traded Jan 30, 2026, 7 days earlier$1,001 - $15,000Since trade +67.5%S&P 500 +11.1% · 56.4 pts ahead of S&P 500
-
Traded Jan 29, 2026, 8 days earlier$1,001 - $15,000Since trade -42.4%S&P 500 +10.8% · 53.2 pts behind S&P 500
Show 57 more trades of the 609 in this reportShow fewer
-
Traded Jan 29, 2026, 8 days earlier$15,001 - $50,000Since trade +0.5%S&P 500 +10.8% · 10.3 pts behind S&P 500
-
Traded Jan 29, 2026, 8 days earlier$1,001 - $15,000Since trade +222.8%S&P 500 +10.8% · 212.0 pts ahead of S&P 500
-
Traded Jan 29, 2026, 8 days earlier$1,001 - $15,000Since trade +3.8%S&P 500 +10.8% · 7.0 pts behind S&P 500
-
Traded Jan 29, 2026, 8 days earlier$1,001 - $15,000Since trade +9.7%S&P 500 +11.4% · 1.7 pts behind S&P 500
-
Traded Jan 29, 2026, 8 days earlier$15,001 - $50,000Since trade -11.9%S&P 500 +11.4% · 23.2 pts behind S&P 500
-
Traded Jan 29, 2026, 8 days earlier$1,001 - $15,000Since trade +16.1%S&P 500 +10.8% · 5.4 pts ahead of S&P 500
-
Traded Jan 29, 2026, 8 days earlier$1,001 - $15,000Since trade -11.8%S&P 500 +10.8% · 22.5 pts behind S&P 500
-
Traded Jan 29, 2026, 8 days earlier$1,001 - $15,000Since trade +61.8%S&P 500 +10.8% · 51.0 pts ahead of S&P 500
-
Traded Jan 29, 2026, 8 days earlier$15,001 - $50,000Since trade +7.0%S&P 500 +10.8% · 3.7 pts behind S&P 500
-
Traded Jan 29, 2026, 8 days earlier$1,001 - $15,000Since trade +2.7%S&P 500 +11.4% · 8.6 pts behind S&P 500
-
Traded Jan 29, 2026, 8 days earlier$1,001 - $15,000Since trade +31.2%S&P 500 +10.8% · 20.4 pts ahead of S&P 500
-
Traded Jan 29, 2026, 8 days earlier$15,001 - $50,000Since trade +5.4%S&P 500 +10.8% · 5.4 pts behind S&P 500
-
Traded Jan 29, 2026, 8 days earlier$1,001 - $15,000Since trade +6.8%S&P 500 +10.8% · 4.0 pts behind S&P 500
-
Traded Jan 29, 2026, 8 days earlier$1,001 - $15,000Since trade -12.0%S&P 500 +10.8% · 22.8 pts behind S&P 500
-
Traded Jan 29, 2026, 8 days earlier$1,001 - $15,000Since trade -21.5%S&P 500 +10.8% · 32.2 pts behind S&P 500
-
Traded Jan 29, 2026, 8 days earlier$1,001 - $15,000Since trade -6.7%S&P 500 +10.8% · 17.5 pts behind S&P 500
-
Traded Jan 29, 2026, 8 days earlier$1,001 - $15,000Since trade +0.2%S&P 500 +10.8% · 10.6 pts behind S&P 500
-
Traded Jan 29, 2026, 8 days earlier$1,001 - $15,000Since trade -14.4%S&P 500 +10.8% · 25.2 pts behind S&P 500
-
Traded Jan 29, 2026, 8 days earlier$1,001 - $15,000Since trade 0.0%S&P 500 +10.8% · 10.8 pts behind S&P 500
-
Traded Jan 29, 2026, 8 days earlier$1,001 - $15,000Since trade -23.8%S&P 500 +10.8% · 34.5 pts behind S&P 500
-
Traded Jan 29, 2026, 8 days earlier$15,001 - $50,000Since trade -19.7%S&P 500 +10.8% · 30.4 pts behind S&P 500
-
Traded Jan 29, 2026, 8 days earlier$15,001 - $50,000Since trade +4.9%S&P 500 +10.8% · 5.9 pts behind S&P 500
-
Traded Jan 29, 2026, 8 days earlier$1,001 - $15,000Since trade +14.1%S&P 500 +10.8% · 3.3 pts ahead of S&P 500
-
Traded Jan 29, 2026, 8 days earlier$1,001 - $15,000Since trade -1.0%S&P 500 +10.8% · 11.8 pts behind S&P 500
-
Traded Jan 29, 2026, 8 days earlier$1,001 - $15,000Since trade +16.3%S&P 500 +10.8% · 5.5 pts ahead of S&P 500
-
Traded Jan 29, 2026, 8 days earlier$1,001 - $15,000Since trade -18.1%S&P 500 +10.8% · 28.8 pts behind S&P 500
-
Traded Jan 29, 2026, 8 days earlier$1,001 - $15,000Since trade +13.5%S&P 500 +10.8% · 2.8 pts ahead of S&P 500
-
Traded Jan 29, 2026, 8 days earlier$1,001 - $15,000Since trade -52.8%S&P 500 +10.8% · 63.5 pts behind S&P 500
-
Traded Jan 29, 2026, 8 days earlier$1,001 - $15,000Since trade +13.3%S&P 500 +11.4% · 2.0 pts ahead of S&P 500
-
sold MSCITraded Jan 29, 2026, 8 days earlier$1,001 - $15,000Since trade -9.4%S&P 500 +11.4% · 20.7 pts behind S&P 500
-
Traded Jan 29, 2026, 8 days earlier$15,001 - $50,000Since trade -7.3%S&P 500 +10.8% · 18.1 pts behind S&P 500
-
Traded Jan 29, 2026, 8 days earlier$1,001 - $15,000Since trade -13.8%S&P 500 +11.4% · 25.2 pts behind S&P 500
-
Traded Jan 29, 2026, 8 days earlier$1,001 - $15,000Since trade -27.3%S&P 500 +10.8% · 38.1 pts behind S&P 500
-
Traded Jan 29, 2026, 8 days earlier$15,001 - $50,000n/a
-
Traded Jan 29, 2026, 8 days earlier$15,001 - $50,000Since trade -0.8%S&P 500 +11.4% · 12.2 pts behind S&P 500
-
Traded Jan 29, 2026, 8 days earlier$1,001 - $15,000Since trade +18.6%S&P 500 +10.8% · 7.9 pts ahead of S&P 500
-
bought POOLTraded Jan 29, 2026, 8 days earlier$1,001 - $15,000Since trade -36.0%S&P 500 +10.8% · 46.8 pts behind S&P 500
-
Traded Jan 29, 2026, 8 days earlier$15,001 - $50,000Since trade -0.5%S&P 500 +10.8% · 11.3 pts behind S&P 500
-
Traded Jan 29, 2026, 8 days earlier$1,001 - $15,000Since trade -27.4%S&P 500 +10.8% · 38.2 pts behind S&P 500
-
Traded Jan 29, 2026, 8 days earlier$15,001 - $50,000Since trade +3.0%S&P 500 +10.8% · 7.7 pts behind S&P 500
-
Traded Jan 29, 2026, 8 days earlier$1,001 - $15,000Since trade +121.2%S&P 500 +10.8% · 110.4 pts ahead of S&P 500
-
Traded Jan 29, 2026, 8 days earlier$15,001 - $50,000Since trade -11.3%S&P 500 +10.8% · 22.1 pts behind S&P 500
-
sold FOXTraded Jan 29, 2026, 8 days earlier$1,001 - $15,000Since trade -12.6%S&P 500 +10.8% · 23.4 pts behind S&P 500
-
Traded Jan 29, 2026, 8 days earlier$15,001 - $50,000Since trade +17.3%S&P 500 +10.8% · 6.6 pts ahead of S&P 500
-
Traded Jan 29, 2026, 8 days earlier$1,001 - $15,000Since trade -13.4%S&P 500 +10.8% · 24.1 pts behind S&P 500
-
Traded Jan 29, 2026, 8 days earlier$1,001 - $15,000Since trade -19.6%S&P 500 +11.4% · 30.9 pts behind S&P 500
-
Traded Jan 29, 2026, 8 days earlier$1,001 - $15,000Since trade +2.4%S&P 500 +10.8% · 8.4 pts behind S&P 500
-
Traded Jan 29, 2026, 8 days earlier$1,001 - $15,000Since trade +40.9%S&P 500 +10.8% · 30.1 pts ahead of S&P 500
-
Traded Jan 29, 2026, 8 days earlier$15,001 - $50,000Since trade +21.9%S&P 500 +10.8% · 11.1 pts ahead of S&P 500
-
Traded Jan 29, 2026, 8 days earlier$1,001 - $15,000Since trade +31.2%S&P 500 +10.8% · 20.4 pts ahead of S&P 500
-
Traded Jan 29, 2026, 8 days earlier$1,001 - $15,000Since trade -6.9%S&P 500 +11.4% · 18.3 pts behind S&P 500
-
Traded Jan 29, 2026, 8 days earlier$1,001 - $15,000Since trade +0.3%S&P 500 +10.8% · 10.5 pts behind S&P 500
-
Traded Jan 29, 2026, 8 days earlier$15,001 - $50,000Since trade +7.7%S&P 500 +10.8% · 3.1 pts behind S&P 500
-
Traded Jan 29, 2026, 8 days earlier$1,001 - $15,000Since trade -25.1%S&P 500 +10.8% · 35.9 pts behind S&P 500
-
Traded Jan 29, 2026, 8 days earlier$1,001 - $15,000Since trade +21.2%S&P 500 +10.8% · 10.4 pts ahead of S&P 500
-
Traded Jan 29, 2026, 8 days earlier$15,001 - $50,000Since trade +4.1%S&P 500 +10.8% · 6.7 pts behind S&P 500
-
Traded Jan 29, 2026, 8 days earlier$1,001 - $15,000Since trade +41.8%S&P 500 +11.4% · 30.4 pts ahead of S&P 500
This report is shortened here: Ro Khanna's page carries all 609 lines.
-
-
-
bought United States Treas Bills Zero Cpn 0.00000% BondTraded Jan 26, 2026, 11 days earlier$1,001 - $15,000n/a
This report is shortened here: William R. Keating's page carries all 2 lines.
-
-
-
Traded Jan 14, 2026, 23 days earlier$100,001 - $250,000Since trade -19.8%S&P 500 +10.6% · 30.4 pts behind S&P 500
This report is shortened here: John W. Hickenlooper's page carries all 4 lines.
-
-
-
Traded Jan 12, 2026, 25 days earlier$50,001 - $100,000Since trade -9.3%S&P 500 +9.9% · 19.1 pts behind S&P 500
This report is shortened here: Virginia Foxx's page carries all 2 lines.
-
-
-
Traded Jan 28, 2026, 8 days earlier$1,001 - $15,000Since trade -0.3%S&P 500 +9.8% · 10.1 pts behind S&P 500
-
-
-
bought Bnp Paribas OtherJointTraded Dec 31, 2025, 36 days earlier$50,001 - $100,000n/a
This report is shortened here: Sheri Biggs' page carries all 5 lines.
-
-
-
Traded Jan 9, 2026, 26 days earlier$1,001 - $15,000Since trade +24.9%S&P 500 +10.0% · 14.9 pts ahead of S&P 500
This report is shortened here: Sheldon Whitehouse's page carries all 4 lines.
-
-
-
bought Sygaldry Technologies OtherTraded Jan 29, 2026, 6 days earlier$15,001 - $50,000n/a
This report is shortened here: Kelly Morrison's page carries all 2 lines.
-
-
-
sold in part Cook Cnty Ill Cmnty Cons Sch Dist No 015 Palatine GO BDS BondJointTraded Jan 21, 2026, 14 days earlier$1,001 - $15,000n/a
This report is shortened here: Markwayne Mullin's page carries all 14 lines.
-
-
-
bought IRENTraded Jan 20, 2026, 14 days earlier$50,001 - $100,000Since trade -25.1%S&P 500 +12.7% · 37.8 pts behind S&P 500
This report is shortened here: Cleo Fields' page carries all 6 lines.
-
-
-
Traded Jan 29, 2026, 4 days earlier$1,001 - $15,000Since trade -33.0%S&P 500 +10.2% · 43.2 pts behind S&P 500
This report is shortened here: David Taylor's page carries all 31 lines.
-
-
-
Traded Jan 30, 2026, 3 days earlier$1,001 - $15,000Since trade -10.5%S&P 500 +10.6% · 21.1 pts behind S&P 500
This report is shortened here: April McClain Delaney's page carries all 15 lines.
-
-
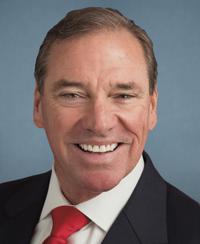 Neal P. DunnRepublican · House · FLFiling date not stated; received Feb 2, 20262 trades in this report
-
exchanged Huntington Bancshares Incorporated - Depositary Shares L Preferred Stock OtherTraded Feb 2, 2026, the same day$1,001 - $15,000Since trade -12.1%S&P 500 +9.8% · 21.9 pts behind S&P 500
This report is shortened here: Neal P. Dunn's page carries all 2 lines.
-
-
-
bought University Wash Univ 4.00% BondJointTraded Jan 29, 2026, 2 days earlier$15,001 - $50,000n/a
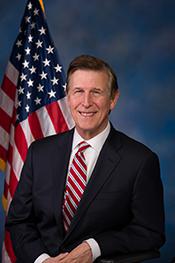
This report is shortened here: Donald S. Beyer, Jr.'s page carries all 4 lines.
-
-
-
Traded Jan 27, 2026, 3 days earlier$100,001 - $250,000Since trade +4.9%S&P 500 +9.6% · 4.7 pts behind S&P 500
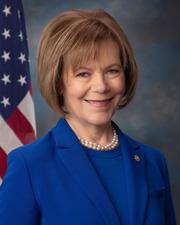
This report is shortened here: Tina Smith's page carries all 2 lines.
-
-
-
bought Alpine Investors Ix FundTraded Jan 7, 2026, 22 days earlier$1,001 - $15,000n/a
This report is shortened here: Max L. Miller's page carries all 2 lines.
-
-
-
Traded Jan 28, 2026, 1 day earlier$1,001 - $15,000Since trade +11.4%S&P 500 +9.8% · 1.5 pts ahead of S&P 500
-
-
-
Traded Dec 29, 2025, 28 days earlier$1,001 - $15,000Since trade +8.5%S&P 500 +11.0% · 2.5 pts behind S&P 500
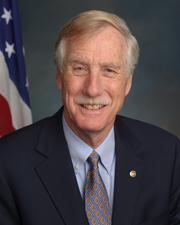
This report is shortened here: Angus S. King Jr.'s page carries all 3 lines.
-













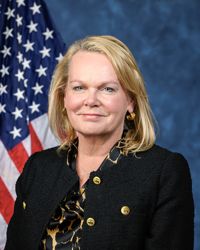


One card is one report. One line is one disclosed trade as we store it: two accounts reporting the same trade in the same band on the same day are one line here. The trade date, filing date, account and value band on each line are read from the report as the member filed it with the House Clerk or the Secretary of the Senate; the days on a line count from the trade to that filing, and the STOCK Act allows 45. A line says "Filed late" only where we have read the report against the original. Where a report has been read against the original, the count on the card is the lines we hold and links to the report itself; the late filings page prints the report's own count. The window is by filing date.
Reports are shown 20 to a page, each with its lines in trade date order. A report longer than 60 lines is shortened here, and so are the reports after the point where a page passes 250 lines; a shortened report says so, and the member's own page carries every line.
Since the trade: the stock's move from the trade date to the latest close we hold, as of Sep 6 to Oct 2, 2026, with the S&P 500 over the same window and the difference against it in points. The numbers describe the stock after the trade, not the member's result: a disclosure carries a band, not a fill, and a sale keeps the same sign, so a positive number after a sale means the stock kept rising. An option line carries the underlying stock's move. Estimates from market prices, not from the reports; n/a on assets with no market price. Not investment advice.