Congressional disclosures
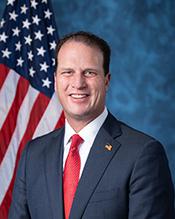
August Pfluger
Latest disclosure: bought shares of Berkshire Hathaway (BRK.B), $15,001 - $50,000, on Mar 13, 2026, filed Apr 15 (33 days).
Free on iOS and Android.


Recent disclosures
20 of 38 on record · traded Apr 12, 2022 to Aug 20, 2026Since the trade: the stock's move from the trade date to the latest close we hold (figures as of Oct 26, 2026), not the member's result. Not investment advice.
| Asset | Type | Action | Amount disclosed | Stock since the trade | Trade date | Disclosed | Delay |
|---|---|---|---|---|---|---|---|
| CHTRDependent childCommunication ServicesAs filed: SHARES RECEIVED THRU MERGER | Stock | Exchange · 2 lines | $1,001 - $15,000 | -26.5%S&P 500 -0.3% · -26.1 pts vs S&P 500 | Aug 20, 2026 | Sep 14, 2026 | 25d |
| LBRDKDependent childCommunication ServicesAs filed: SHARES SURRENDERED THRU MERGER | Stock | Exchange · 2 lines | $1,001 - $15,000 | n/a | Aug 20, 2026 | Sep 14, 2026 | 25d |
| BRK.B | Stock | Purchase | $15,001 - $50,000 | +10.6%S&P 500 +14.7% · -4.0 pts vs S&P 500 | Mar 13, 2026 | Apr 15, 2026 | 33d |
| EPDEnergy | Stock | Purchase | $15,001 - $50,000 | +0.2%S&P 500 +14.7% · -14.4 pts vs S&P 500 | Mar 13, 2026 | Apr 15, 2026 | 33d |
| DMLPDORCHESTER MINERALS, L.P. - COMMON UNITS REPRESENTING LIMITED PARTNERSHIP…Energy | Stock | Purchase | $15,001 - $50,000 | +13.6%S&P 500 +14.7% · -1.1 pts vs S&P 500 | Mar 13, 2026 | Apr 15, 2026 | 33d |
| KRPKIMBELL ROYALTY PARTNERS COMMON UNITS REPRESENTING LIMITED PARTNER INTERESTSEnergy | Stock | Purchase | $15,001 - $50,000 | +15.1%S&P 500 +14.7% · +0.5 pts vs S&P 500 | Mar 13, 2026 | Apr 15, 2026 | 33d |
| VNOMVIPER ENERGY, INC. - CLASS A COMMON STOCKEnergy | Stock | Purchase | $15,001 - $50,000 | +6.1%S&P 500 +14.7% · -8.6 pts vs S&P 500 | Mar 13, 2026 | Apr 15, 2026 | 33d |
| AMERCO - SERIES N NON-VOTINGIndustrials | Stock | Purchase | $15,001 - $50,000 | n/a | Mar 13, 2026 | Apr 15, 2026 | 33d |
| WBDCommunication Services | Stock | Sale | $1,001 - $15,000 | +11.3%After the saleS&P 500 +11.9% · -0.6 pts vs S&P 500 | Feb 10, 2026 | Mar 19, 2026 | 37d |
| SIRIDependent childCommunication Services | Stock | Sale | $1,001 - $15,000 | +32.8%After the saleS&P 500 +9.5% · +23.3 pts vs S&P 500 | Jan 13, 2026 | Feb 11, 2026 | 29d |
| FNFFinancial Services | Stock | Sale | $1,001 - $15,000 | -24.5%After the saleS&P 500 +9.3% · -33.8 pts vs S&P 500 | Jan 12, 2026 | Feb 11, 2026 | 30d |
| LLYVKLIBERTY MEDIA CORPORATION - SERIES C LIBERTY LIVE COMMON STOCKDependent childAs filed: SHARES RECEIVED THRU MERGER | Stock | Exchange | $1,001 - $15,000 | +18.0%S&P 500 +11.9% · +6.1 pts vs S&P 500 | Dec 16, 2025 | Jan 20, 2026 | 35d |
| FWONKDependent childCommunication ServicesAs filed: SHARES SURRENDERED THRU MERGER | Stock | Exchange | $1,001 - $15,000 | -6.8%S&P 500 +11.9% · -18.7 pts vs S&P 500 | Dec 16, 2025 | Jan 20, 2026 | 35d |
| DISCommunication Services | Stock | Sale | $1,001 - $15,000 | -8.9%After the saleS&P 500 +23.0% · -31.9 pts vs S&P 500 | Jul 1, 2025 | Jul 23, 2025 | 22d |
| SIRICommunication Services | Stock | Sale | $1,001 - $15,000 | +16.9%After the saleS&P 500 +23.0% · -6.1 pts vs S&P 500 | Jul 1, 2025 | Jul 23, 2025 | 22d |
| LLYVKLIBERTY MEDIA CORPORATION - SERIES C LIBERTY LIVE COMMON STOCK | Stock | Sale | $1,001 - $15,000 | +24.4%After the saleS&P 500 +23.0% · +1.4 pts vs S&P 500 | Jul 1, 2025 | Jul 23, 2025 | 22d |
| WBDSpouseCommunication Services | Stock | Sale | $1,001 - $15,000 | +214.5%After the saleS&P 500 +33.3% · +181.3 pts vs S&P 500 | Jan 13, 2025 | Feb 15, 2025 | 33d |
| SIRICommunication ServicesAs filed: ORIGINALLY LIBERTY MEDIA LSXMK. SPLIT OFF OF COMPANIES. | Stock | Exchange · 2 lines | $1,001 - $15,000 | +0.9%S&P 500 +38.5% · -37.6 pts vs S&P 500 | Sep 10, 2024 | Aug 13, 2025 | 337d |
| WBDCommunication Services | Stock | Purchase | $1,001 - $15,000 | +25.4%S&P 500 +76.8% · -51.4 pts vs S&P 500 | Apr 12, 2022 | May 25, 2022 | 43d |
| MSFTTechnology | Stock | Sale | $15,001 - $50,000 | +86.0%After the saleS&P 500 +73.4% · +12.6 pts vs S&P 500 | Apr 12, 2022 | May 25, 2022 | 43d |
No disclosures of that kind among the 20 rows shown.
Showing the 20 most recent disclosures. Lines for the same asset, day, band and action are shown once and marked with the number of lines. All of August Pfluger's trades in the browser, every line of every report.
"Dates conflict" marks a row whose disclosure is dated before its trade on the record we hold. Both dates are printed as filed, and no since-the-trade figure is computed from them.
Under each figure: the S&P 500 over the same window, and the gap between the stock and the index in percentage points. A disclosure carries a band, not a fill. After a sale the stock's move keeps its sign, so a positive number means the stock kept rising after the sale. An option row carries the underlying stock's move, not the option's value. Where a ticker stopped trading the row says when its price history ends; where the company trades on under a new ticker the figure is priced under that one. Estimates; n/a where we hold no figure for the row.
Estimated portfolio
14 holdings · $250,001 - $500,000 in total · estimate, as of Oct 25, 2026| Holding | Estimated value | Share of portfolio |
|---|---|---|
| BRK.B | $100,001 - $250,000 | |
| AKRE | $50,001 - $100,000 | |
| EPD | $15,001 - $50,000 | |
| KRP | $15,001 - $50,000 | |
| DMLP | $15,001 - $50,000 | |
| VNOM | $15,001 - $50,000 | |
| FUND | $15,001 - $50,000 | |
| ICE | $15,001 - $50,000 | |
| CHTR | $15,001 - $50,000 | |
| PM | $1,001 - $15,000 |
The 10 largest of 14 estimated holdings of $1,000 or more; 1 smaller position makes up under 0.1% of the total. Every figure is an estimate built from the ranges on the member's financial disclosure reports, marked by the price movement of each stock since the filing; the share is of the whole estimated portfolio, small positions included. These are the stock and fund positions the model prices; the net worth estimate above also counts other disclosed assets and subtracts liabilities.
Year by year
buy volume against sale and exchange volume · range midpoints- 2026
- 2025
- 2024
- 2023
- 2022
- 2021
Disclosed volume per year the member traded, 2021 to 2026. A filing gives a range, not an amount, so each bar sums the midpoints of the ranges disclosed that year: a $1,001 to $15,000 line counts as $8,000. The sale side also counts exchanges, including shares received in a spin-off or merger.
Where the disclosed portfolio sits
share of the estimated portfolioGetSignal pushes each new disclosure to your phone as it lands, with the full history and every other member. Free on iOS and Android.
Questions
How many stock trades has August Pfluger disclosed?
August Pfluger has disclosed 38 transactions under the STOCK Act. This page lists the 20 most recent, covering Apr 12, 2022 to Aug 20, 2026.
How long does August Pfluger take to report a trade?
In the filings on record the median gap between a trade and its disclosure is 40 days. The STOCK Act allows up to 45.
Which tickers does August Pfluger trade most?
Among the 20 disclosures shown, the tickers that appear most include SIRI (3), WBD (3) and LLYVK (2).
Which accounts do August Pfluger's disclosures name?
Of the 20 disclosures shown, 1 names a spouse's account and 5 a dependent child's account. 14 do not name an account. The account is whatever the filer wrote on the disclosure; a spouse's or a joint account is disclosed under the member's name, as the STOCK Act requires.
Where does the estimated net worth on this page come from?
A model's estimate, not a figure the member filed. Reports give every asset and debt as a range, so the model takes a value inside each range, subtracts debts and prices the stocks it tracks at the latest close we hold. We round it because the top range has no upper limit. It covers only what the reports carry and is not a measure of anyone's wealth. The methodology page sets out how it is built and what it leaves out.
How have the stocks moved since August Pfluger's trades?
Across the 18 priced rows shown, the median stock move from the trade date to the latest close we hold (figures as of Oct 26, 2026) is +12.5%. That figure is an estimate describing the stock after each trade, not the member's result: a disclosure carries a band, not a fill, a sale keeps the same sign, and an option row carries the underlying stock's move. 2 of the rows shown have no figure in our data.
How to read a STOCK Act filing
WHAT THE FILING ACTUALLY SAYS
A disclosure is a record of a transaction, not evidence of anything else, and nothing here is investment advice. Sourcing and the limits of this data are on the methodology page. How these reports work is explained in our guide to STOCK Act reports.
Data as of Oct 26, 2026.